Quiz Templates · Math
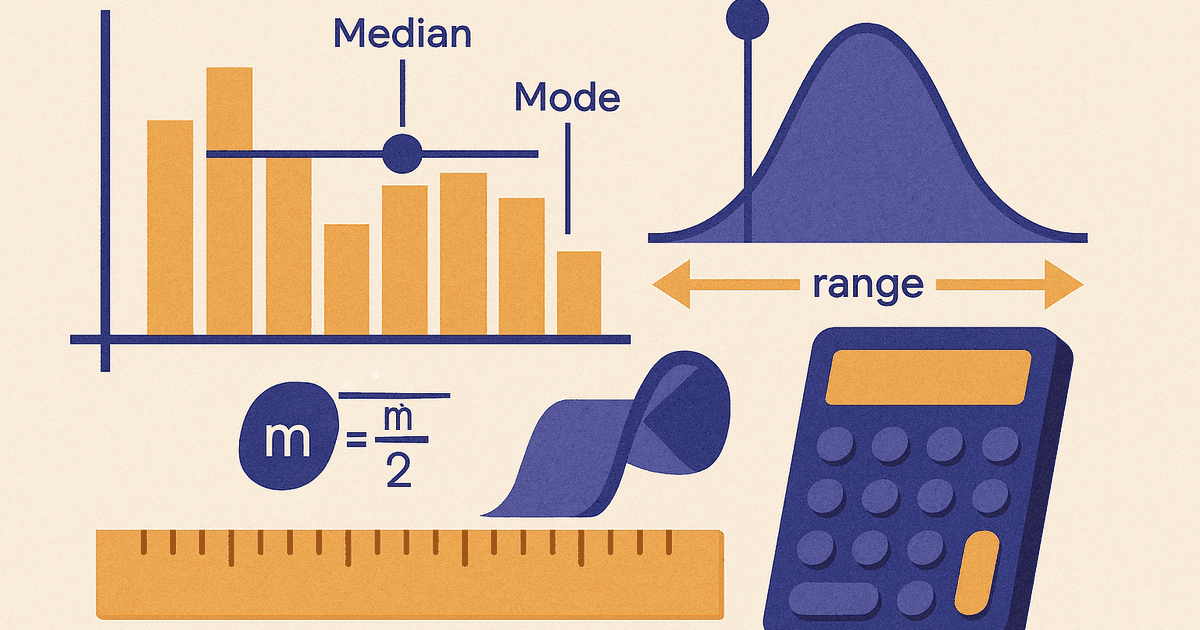
Statistics Unit Review Quiz Template
This template reviews core statistics concepts: measures of center and spread, reading data displays, and basic probability. Use it before a unit test or as a study guide.
Generate this quiz now
Free account required · 5 AI quiz generations a month, up to 10 questions each. No credit card needed.
Sign Up & Generate — FreeWhat's in this template
- · Mean, median, and mode
- · Range and standard deviation
- · Interpreting box plots and histograms
- · Interpreting scatter plots and correlation
- · Basic probability of a single event
- · Identifying outliers and their effect on the mean
Sample questions
A preview of the kind of questions this template generates:
- Find the mean of the data set: 4, 8, 6, 10, 2 (6, since the sum is 30 and there are 5 values)
- Find the median of the data set: 3, 7, 9, 12, 15 (9, the middle value)
- A data set has a mean of 20 and a standard deviation of 4. Is a value of 30 unusually high? (Yes — it's 2.5 standard deviations above the mean)
- A bag has 4 red marbles and 6 blue marbles. What is the probability of drawing a red marble? (4/10 = 2/5 = 0.4)
- In a box plot, what does the length of the box represent? (The interquartile range — the middle 50% of the data)
Who this template is for
- · Pre-test unit review — cover measures of center, spread, and data displays in one sitting before the statistics unit exam.
- · Data-literacy check — confirm students can read a box plot or histogram, not just calculate a mean by hand.
- · AP Statistics or Algebra 2 review — a broad-coverage refresher that fits either course's stats unit.
- · Homeschool milestone check — verify core statistics vocabulary and calculations are solid before moving to inferential statistics.
Frequently Asked Questions
Does this quiz require a calculator for standard deviation?▾
A couple of questions reference standard deviation conceptually (like judging whether a value is unusually high), but the template doesn't require computing standard deviation by hand from a raw data set — if your course does test that calculation, add "including calculating standard deviation from a raw data set" to the topic.
Is this for Algebra 2 statistics or a full standalone statistics course?▾
It's written at a level that fits either — the core topics (mean/median/mode, spread, data displays, basic probability) overlap heavily between an Algebra 2 statistics unit and an introductory statistics course.
How do I generate this quiz on SimpleQuizMaker?▾
Sign up for a free account and paste the prefilled topic into the AI quiz generator to build the quiz automatically. Free accounts get 5 AI-generated quizzes per month, up to 10 questions each, which covers this template comfortably.
Can I make a version focused only on reading graphs, without the calculation questions?▾
Yes — change the topic to "interpreting box plots, histograms, and scatter plots" and regenerate for a quiz that's entirely about reading data displays rather than computing statistics.
Ready to build it?
Free account required · 5 AI quiz generations a month, up to 10 questions each. No credit card needed.
Sign Up & Generate — Free